Output Files
damagePlot.pdf
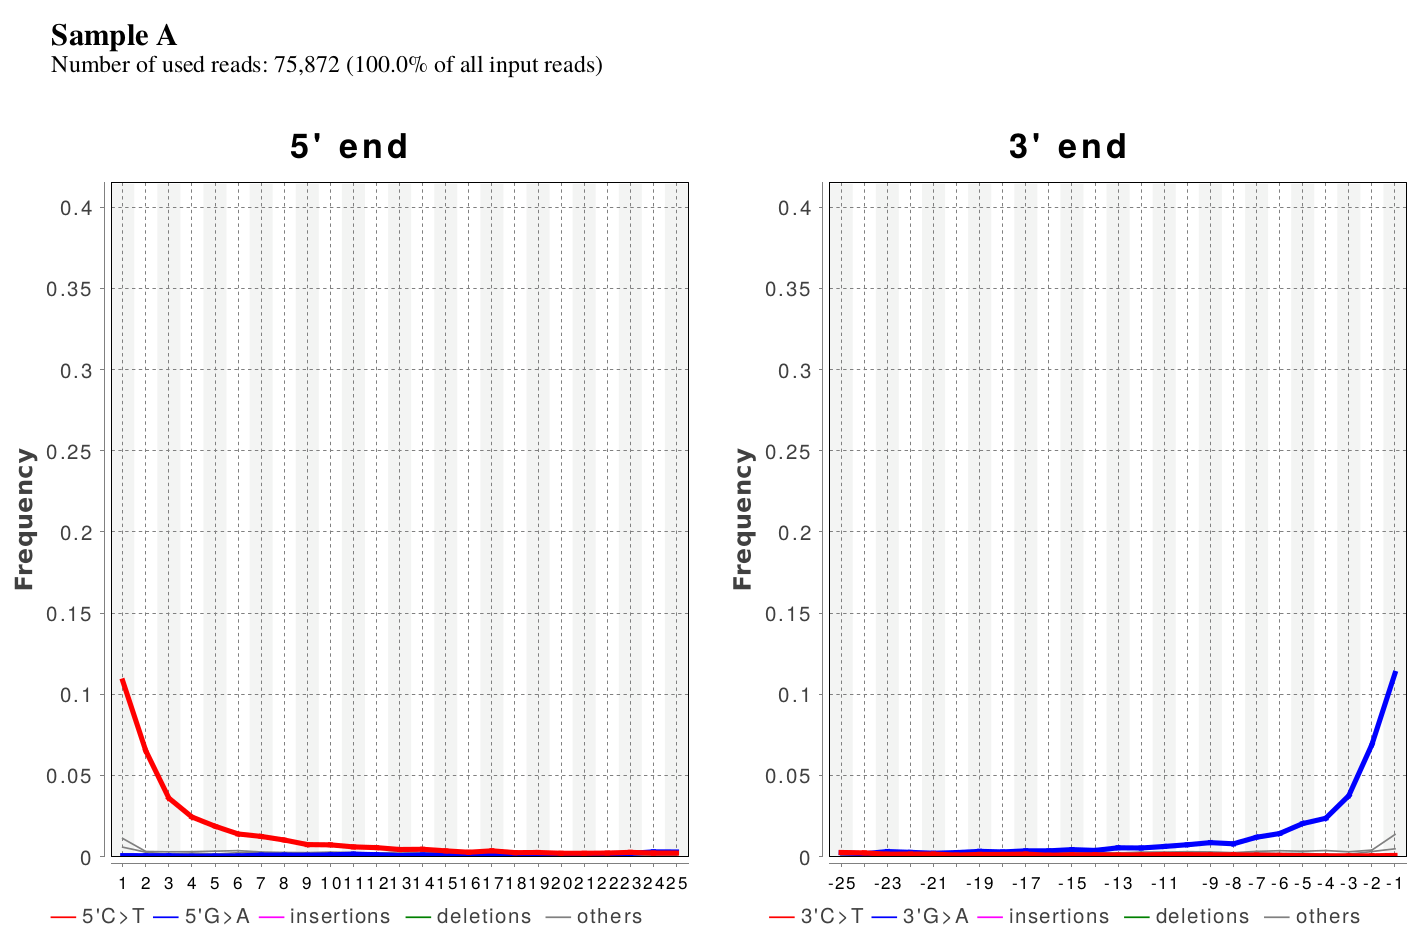
The damage plot visualizes the frequency of the particular base misincorporations, deletions, and insertions that occur in the considered reads. The 5’ and 3’ end of the reads are displayed on the left and right side, respectively. The The x-axis show the position, and the y-axis the frequency. The files DamagePlot_five_prime.svg and DamagePlot_three_prime.svg contain the visualization as vector graphic for easy further processing.
5pCtoT_freq.txt and 3pGtoA_freq.txt
These files are tab separated text files, containing the frequency of Cytosine to Thymine and Guanine to Adenine base miscorporation at the 5’ and 3’ends, respectively, on which the damage plot is based. The header covers the first three lines, followed by two columns. The first column is the position, starting from the end of the fragment, and the second column contains the frequency of the respective base exchange.
Example 5pCtoT_freq.txt:
# table produced by DamageProfiler
# using mapped file SampleA.bam
# Sample ID: SampleA
pos     5pC>T
1       0.10827902672270852
2       0.06525024039562251
3       0.036067620785707424
4       0.024446388287832053
5       0.018777467039552537
6       ....
Example 3pGtoA_freq.txt:
# table produced by DamageProfiler
# using mapped file SampleA.bam
# Sample ID: SampleA
pos     3pG>A
1       0.11289934178840906
2       0.06908510152863336
3       0.037617996524679474
4       0.023695811903012492
5       0.020417402326950065
6       ....
length_plot.pdf
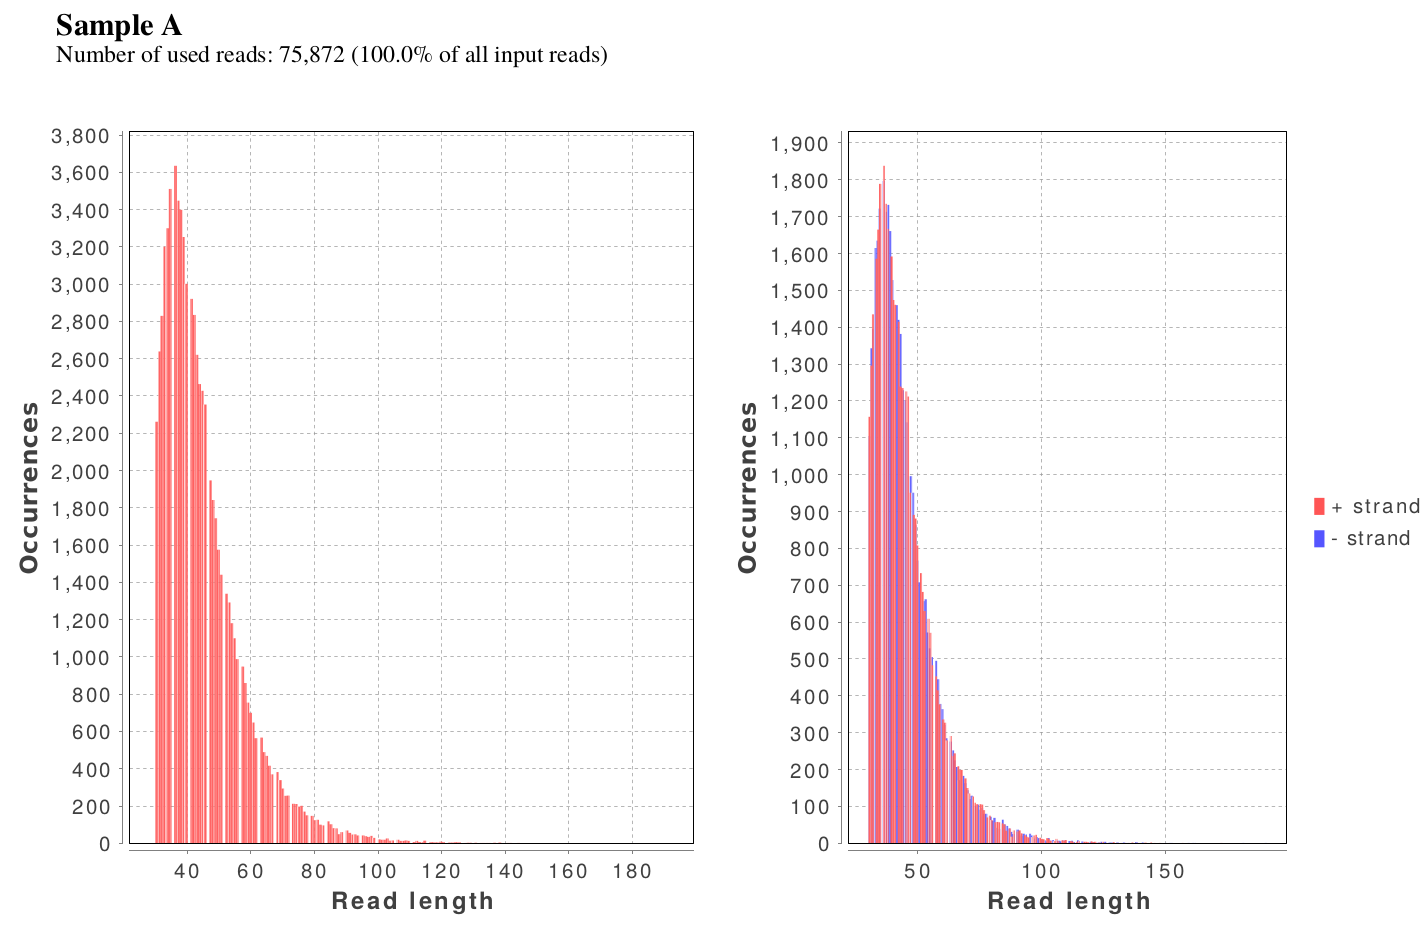
This figure visualizes the length distribution of all considered reads. The reads length is shown on the x-axis, the number of reads per lentgh on the y-axis. The plot on the left side shows the length histogram of all reads, while the right side separates the reads based on strand orientation. The files Length_plot_combined_data.svg and Length_plot_forward_reverse_separated.svg provide the plots in svg format.
lgdistribution.txt
This text file contains a table with read length distributions per strand.
# table produced by DamageProfiler
# using mapped file SampleA.bam
# Sample ID: SampleA
# Std: strand of reads
Std     Length  Occurrences
+       30.0    1157
+       31.0    1296
+       32.0    1435
...
-       30.0    1105
-       31.0    1343
-       32.0    1395
edit_distance.pdf
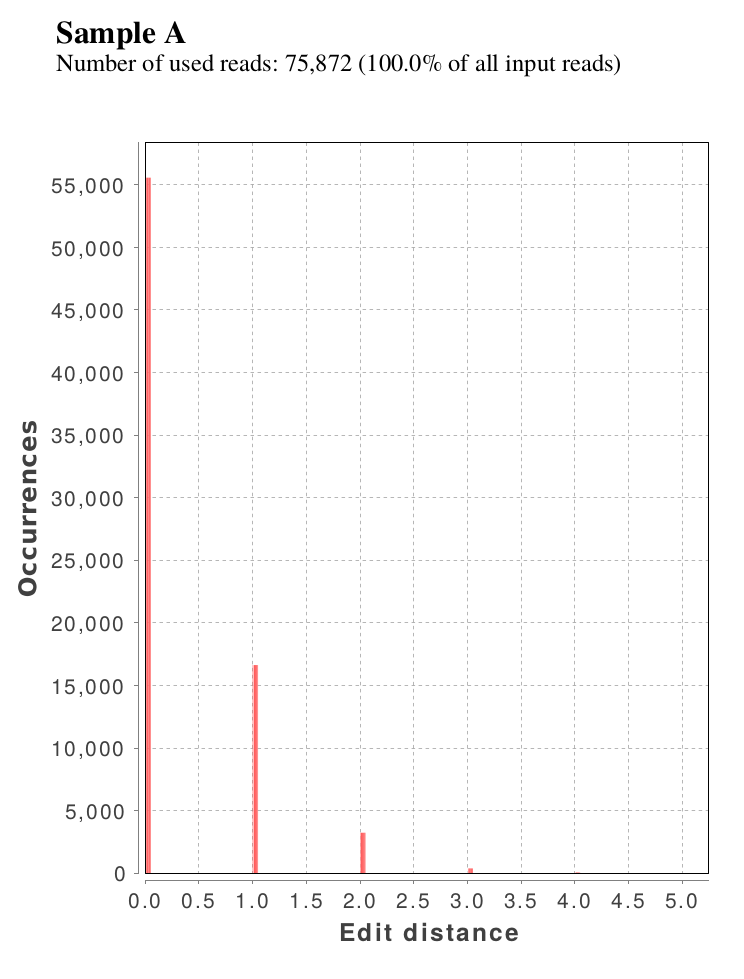
A histogram visualizing the number of bases that differ between read and reference. The number of bases (=distance) is shown on the x-axis, the number of reads having this distance (=occurrences) on the y-axis. The file edit_distance.svg provides the plot in svg format.
editDistance.txt
This file contains the edit distance distribution of all mapped reads. The edit distance is calculated as the hamming distance between mapped read and the reference.
#Edit distances for file: SampleA.bam
    Edit distance   Occurrences
0.0 55569
    1.0     16627
    2.0     3230
    4.0     58
    5.0     9
    3.0     379
misincorporation.txt
This file contains a table with occurrences for each mutations type. The positions are relative positions from the end of the reads.
# table produced by DamageProfiler
# using mapped file SampleA.bam
# Sample ID: SampleA
Chr     End     Std     Pos     A       C       G       T       Total   G>A     C>T     A>G     T>C     A>C     A>T     C>G     C>A     T>G     T>A     G>C     G>T     A>-     T>-     C>-     G>-     ->A     ->T     ->C     ->G     S
gi|15826865|ref|NC_002677.1|    3p      +       1       10346.0 8283.0  12587.0 6732.0  37948.0 1401.0  6.0     12.0    12.0    5.0     6.0     46.0    100.0   7.0     8.0     2.0     7.0     0.0     0.0     0.0     0.0     0.0     0.0     0.0     0.0     0.0
gi|15826865|ref|NC_002677.1|    3p      +       2       10329.0 9630.0  11018.0 6971.0  37948.0 775.0   5.0     8.0     7.0     0.0     2.0     33.0    44.0    4.0     4.0     1.0     8.0     0.0     0.0     0.0     0.0     0.0     0.0     0.0     0.0     0.0
gi|15826865|ref|NC_002677.1|    3p      +       3       8692.0  10553.0 10715.0 7988.0  37948.0 419.0   8.0     4.0     9.0     1.0     1.0     17.0    36.0    2.0     5.0     0.0     9.0     0.0     0.0     0.0     0.0     0.0     0.0     0.0     0.0     0.0
gi|15826865|ref|NC_002677.1|    3p      +       4       8959.0  9757.0  10990.0 8242.0  37948.0 259.0   9.0     9.0     9.0     2.0     1.0     3.0     39.0    1.0     3.0     0.0     13.0    0.0     0.0     0.0     0.0     0.0     0.0     0.0     0.0     0.0
gi|15826865|ref|NC_002677.1|    3p      +       5       8606.0  10261.0 11081.0 8000.0  37948.0 236.0   6.0     1.0     9.0     0.0     1.0     2.0     34.0    0.0     1.0     0.0     19.0    0.0     0.0     0.0     0.0     0.0     0.0     0.0     0.0     0.0
gi|15826865|ref|NC_002677.1|    3p      +       6       8650.0  10351.0 10797.0 8148.0  37946.0 171.0   8.0     2.0     5.0     0.0     0.0     4.0     43.0    4.0     3.0     0.0     21.0    0.0     0.0     0.0     0.0     1.0     0.0     0.0     0.0     0.0
gi|15826865|ref|NC_002677.1|    3p      +       7       8573.0  10386.0 10765.0 8221.0  37945.0 132.0   7.0     2.0     1.0     0.0     0.0     1.0     37.0    0.0     3.0     0.0     20.0    0.0     0.0     0.0     0.0     1.0     0.0     1.0     0.0     0.0
...
5p_freq_misincorporations.txt and 3p_freq_misincorporations.txt
These files contain the frequencies of all base substitutions per position from the 5’ and 3’-ends, respectively.
Example file 5p_freq_misincorporations.txt:
# table produced by DamageProfiler
# using mapped file SampleA.bam
# Sample ID: SampleA
Pos     C>T     G>A     A>C     A>G     A>T     C>A     C>G     G>C     G>T     T>A     T>C     T>G     ->ACGT  ACGT>-
0       0.108279        0.000671        0.000800        0.000640        0.001440        0.000771        0.000270        0.005859        0.011229        0.000428        0.000808        0.000238        0.000000        0.000000
1       0.065250        0.000631        0.000438        0.001168        0.000876        0.000870        0.000321        0.002786        0.003206        0.000047        0.000328        0.000141        0.000013        0.000000
2       0.036068        0.000591        0.000130        0.000972        0.000324        0.001489        0.000192        0.001364        0.003000        0.000057        0.000057        0.000170        0.000013        0.000000
...
Example file 3p_freq_misincorporations.txt:
# table produced by DamageProfiler
# using mapped file SampleA.bam
# Sample ID: SampleA
Pos     C>T     G>A     A>C     A>G     A>T     C>A     C>G     G>C     G>T     T>A     T>C     T>G     ->ACGT  ACGT>-
24      0.002608        0.002441        0.000180        0.000240        0.000420        0.002181        0.000095        0.000188        0.002582        0.000119        0.000238        0.000000        0.000013        0.000000
23      0.002354        0.001864        0.000000        0.000427        0.000244        0.002169        0.000185        0.000096        0.002151        0.000118        0.000533        0.000059        0.000000        0.000000
22      0.001550        0.003177        0.000122        0.000183        0.000183        0.002114        0.000000        0.000000        0.002210        0.000061        0.000545        0.000061        0.000000        0.000000
...
DNA_comp_genome.txt
This file contains the basic composition of the sample and parts of the reference to which reads could be mapped.
# table produced by DamageProfiler
# using mapped file SampleA.bam
# Sample ID: SampleA
DNA base frequencies Sample
A       C       G       T
0.22213326590555602     0.27659893507234273     0.27791730492742206     0.2233504940946792

DNA base frequencies Reference
A       C       G       T
0.21893033130130574     0.27975782084628925     0.28107944489437814     0.2202324029580269
DNA_composition_sample.txt
This files contains the base composition of the reads mapping to the sample per chromosome (Chr), end (End), strand direction (Std) and position (Pos).
# table produced by DamageProfiler
# using mapped file SampleA.bam
# Sample ID: SampleA
Chr     End     Std     Pos     A       C       G       T       Total
gi|15826865|ref|NC_002677.1|    3p      +       1       11832   8150    11242   6724    37948
gi|15826865|ref|NC_002677.1|    3p      +       2       11142   9556    10279   6971    37948
gi|15826865|ref|NC_002677.1|    3p      +       3       9146    10502   10310   7990    37948
gi|15826865|ref|NC_002677.1|    3p      +       4       9248    9717    10731   8252    37948
gi|15826865|ref|NC_002677.1|    3p      +       5       8875    10228   10829   8016    37948
gi|15826865|ref|NC_002677.1|    3p      +       6       8866    10301   10615   8166    37948
...
dmgprof.json
The values for the damage profil, the length distribution, and some additional statistics, such as mean, median, and standard deviation of the length distribution are given in json format as well. This is a very common data format for easy data interchange. It is platform independent and usable with many modern programming languages and applications.
DamageProfiler.log
Each step of the analysis is documented in this file, which facilitates later reproduction of the analysis.